2.3.3 Step 3: Interpret Task Data
 11 آبان 1400 · · خواندن 7 دقیقه
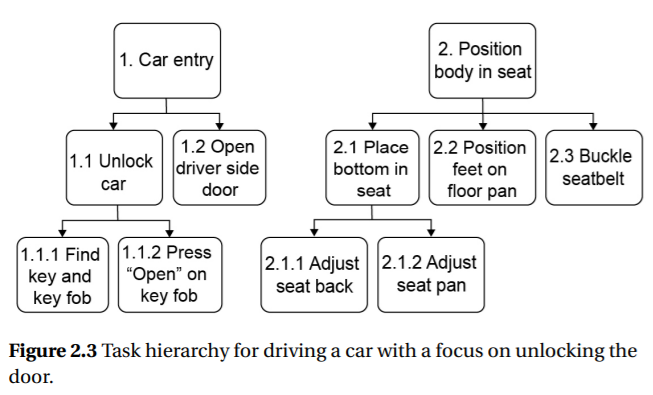
Once task-related information has been collected, it must be organized,
summarized, and analyzed. At the simplest level, the task
analysis might be summarized as a list of challenges faced by people.
As an example, observing drivers trying to unlock their cars
during aWisconsin winter could show how fumbling for keys might
threaten drivers with frostbite. Sometimes these challenges can
inspire important innovations, but often a more detailed analysis
of tasks is needed to identify solutions and to avoid unintended
consequences. Some of the most common ways to organize task
data include:
1. Task hierarchy: Goal, task, subtask decomposition
2. Task flow: Control, decisions regarding the flow from one
task to another
3. Task sequence: Task duration and sequence, as well as communication
between system components
Task hierarchy data can be shown as an arrangement of tasks
where tasks are broken into more specific subtasks. Goals are at the
top of the hierarchy and the tasks at the bottom represent detailed
actions needed to accomplish those goals. The tasks higher in the
hierarchy are why the ones below are performed, and the tasks
lower in the hierarchy describe how the tasks above are achieved.
A task hierarchy makes it possible to organize a complex array of
many actions into a few general tasks, linking a detailed description
to a more general description.
Figure 2.3 shows a task hierarchy for unlocking a car prior to
driving. General tasks, such as “Car entry” are broken into more
specific tasks, such as “Unlock car” and “Open driver side door.”
These are further broken into very specific actions. For “Unlock car”
thismight include “Find key and key fob”, “Press Open on key fob,”
and so on. The level of task hierarchy should be aligned with the
purpose of the analysis and should avoid unnecessary detail. Figure
2.3 shows how the purpose of the analysis focuses attention on
describing unlocking the car and so the “Buckle seatbelt” activity
is not broken into subtasks.
A task hierarchy prompts innovation by identifying different
ways of achieving the same overall task with different subtasks. For
example, considering different ways you can perform“Car entry”
may lead to the use of a smart phone rather than keys. A task hierarchy
also makes it easy for the analyst to develop spreadsheets to
record information for each task or subtask. The spreadsheet contains
a row for each task, and columns for information describing
the tasks. This information might include task duration, conditions
thatmust be met to performthe tasks, why the task is difficult, common
errors, strategies, skills, or knowledge. One simple analysis
that might be part of a time-motion study is to use a spreadsheet
to calculate total task time and compare it with a new design with
different tasks
Figure 2.3 Task hierarchy for driving a car with a focus on unlocking the
door.
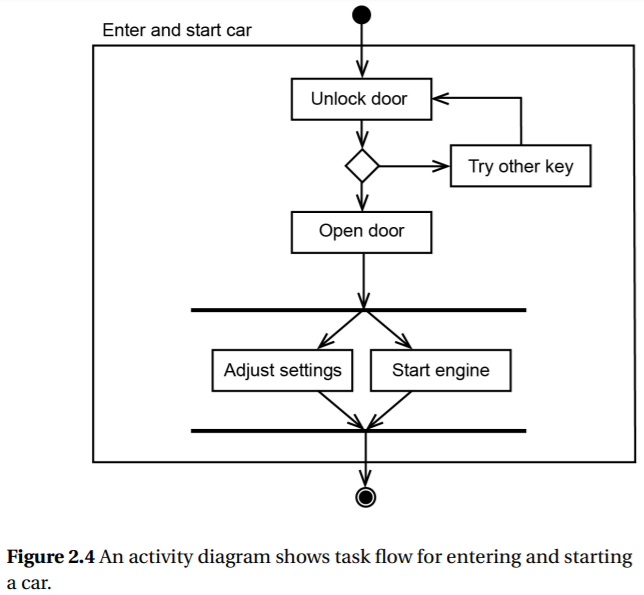
Task flow data from one task to another is captured by a flow
chart. Activity diagrams build on flow charts and also show tasks
that are performed concurrently (Figure 2.4). This diagramshows
the flow from one task to another and the decision points that
determine which task should follow. The flow from one task to
another can be sequential, shown as an arrow connecting tasks,
which are shown as rounded rectangles. The flow can also be
branched, where the decision to flow to one task or another is
indicated by a diamond. The flow can also be concurrent where
tasks can occur in parallel, which is indicated by a set of tasks
bounded on the top and bottom by horizontal bars.
Figure 2.4 An activity diagram shows task flow for entering and starting
a car.
Figure 2.4 shows an activity diagram for the entering and starting
the car. It begins with unlocking the door and finishes when
the settings are adjusted and the engine is started. The diamond
after the unlock door indicates that the door can be opened only
if the correct key is turned and loop from the diamond back to
unlock door indicates that keys are tried until the correct one is
inserted. After opening the door, the horizontal bar indicates that
the settings can be adjusted and the engine can be started in any
order.
Activity diagrams highlight decisions and the information required
to make them. Sometimes this information is trivial and
built into the interaction, such as the resistance experienced with
the wrong key is used to open a car door. In other situations, identifying
the cues that guide decisions can specify critical information
for an interface. Activity diagrams also indicate mandatory
ordering of tasks that need to be conveyed through the physical
configuration of the device, the interface, or through instructions.
In the case of a car, the physical configuration of the door and
key makes it impossible to start the engine before opening the
door. Positive locking of the door by a keyfob only outside the car
makes it impossible to lock ones keys in the car. Beyond inspecting
these diagrams, it is possible to “run” these diagrams as a computer
simulation and estimate the time it takes to performthese tasks.
Y Activity diagrams capture task
flow and information.
Sequence diagrams capture
task sequence and timing.
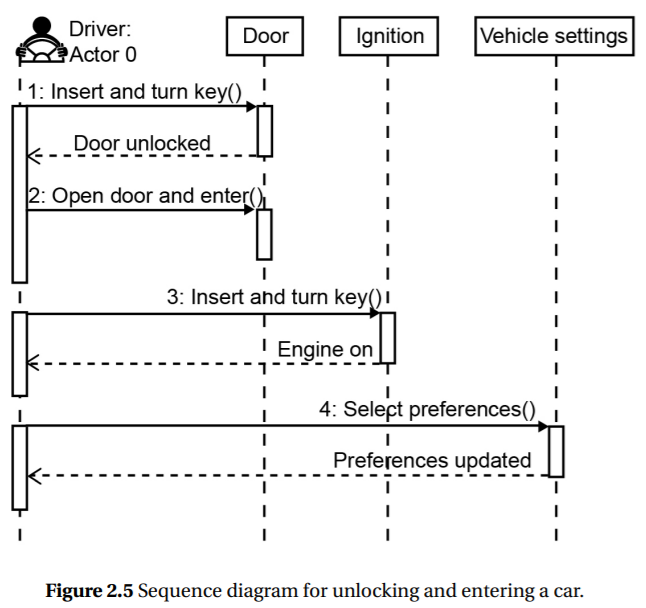
Task sequence data are shown in sequence diagrams that show
the order and duration tasks for each object and person in the
system. The activity of each person and object is represented as a
timeline that runs from the top of the diagram to the bottomand
rectangles on this timeline indicate when the person or object is
active in responding to other elements of the system. Horizontal
arrows indicate communication between people and objects. Solid
lines and arrows indicate synchronous messages, where a response
is required before other activities can proceed. Dashed lines with
open arrows indicate asynchronous messages, where activities can
proceed without a response. Responses are indicated by dashed
lines with open arrows at the of a rectangle.
Figure 2.5 Sequence diagram for unlocking and entering a car.
Figure 2.5 shows a sequence diagram for entering and turning
on a car. The left-most timeline begins with the driver inserting
a key into the door. The next timeline indicates the feedback provided
by the door that the door is unlocked. The driver then inserts
the key into the ignition and tries to start the car, which is indicated
by the engine being on. This figure shows a sequence diagram,
which focuses on one of many particular sequences of tasks. It
shows the sequence associated with inserting the correct key and
not what would have happened with the incorrect key or using
a key fob. Fault tree analysis (see Chapter 16 on system safety)
directly addresses how the probability of failure associated with
many tasks combine to influence safety. Sets of tasks with many
decision points are better represented by activity diagrams than by
sequence diagrams.
Sequence diagrams highlight communication, particularly the
responses that provide people with feedback regarding the success
or failure of their actions. Interaction design should ensure clear
and timely feedback. Diagrams that have manymessages that cross
several timelines indicate a need to reorganize and simplify the
communication so that each person or object communicates with
neighbors and that messages only occasionally cross timelines.
One way to avoid messages crossing multiple timelines is to ensure
that each object and person has a clear role that describes how it is
responds to messages. High activity for one person and low activity
for another might indicate workload that could be balanced by
adjusting the roles of each.
Representing task analysis data as hierarchies, flows, and sequences have advantages and disadvantages, and choosing the
most appropriate method depends on the type of activity being
analyzed. If the tasks are usually done in a sequential manner,
as is the case with entering and starting a car, it is appropriate to
use a sequence diagram. If there are many decision points and
conditions for choosing among actions, then an activity diagram
might be more useful. There is a major disadvantage to activity
and sequence diagrams that is often not readily apparent. People
think about goals and tasks in hierarchies. To be consistent with
such thinking, the design of controls and displays should reflect
these hierarchies. However, when describing or performing a task,
the actions will appear as a linear sequence. If the task analysis is
represented in an activity or sequence diagram, the importance of
cognitive groupings described in the task hierarchy might be lost.
This makes it harder for the designer to match the interface to how
the person thinks about the system. To develop efficient interfaces,
designers must consider the hierarchical structure, decision points,
and the linear sequence of tasks.
Y Match the representation of
tasks—hierarchy, flow, and
sequence—to the design
issue.