my blog

2.3.4 Step 4: Innovate from Task Data

fizik100 fizik100 fizik100 · 1400/8/11 17:40 ·

Task analysis reveals the potential to help people by creating new
systems or revising existing systems. Sometimes these insights
come immediately from observations of people interacting with an
existing system, such as a driver getting cold hands trying to unlock
her car in frigid winter weather. But often these insights come
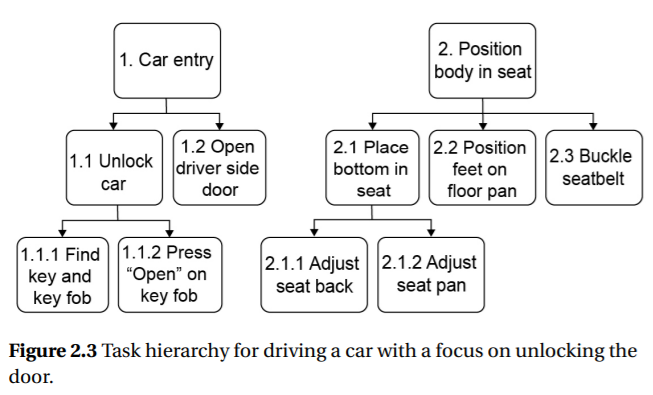
from careful analysis of task hierarchy, flow or sequence, such
as feedback indicating when the door has been unlocked. This
analysis can be qualitative, with a focus on empathy and general
insights about the users’ experiences. It can also be quantitative,
where tasks are described in terms of frequency of occurrence,
probability of a failure, and task duration. This focus on task details
needs to be placed in the broader user experience and then linked
to design solutions. Here we discuss developing personae and use
scenarios as first steps in linking task analysis results to system
specifications.

specifications.
User identification and persona development describes the
most important user populations of the product or system. For
example, designers of amore accessible ATMmight characterize
the user population as people ranging from teenagers to senior
citizens, having at least a third-grade English reading level, and
a range of possible physical disabilities. After identifying characteristics
of the user population, designers should also specify the
people who will be installing or maintaining the systems.

It is important to completely describe the potential user population.
This usually includes characteristics such as age, gender,
education level or reading ability, physical size, physical abilities (or
disabilities), familiarity with the type of product, and task-relevant
skills. For situations where products or systems already exist, one
way that designers can determine the characteristics of users is to sample the existing population of users. For example, the ATM designer
might measure the types of people who currently use ATMs.
However, this will result in a description of users who are capable
of using, and do use, the existing ATMs. This is not an appropriate
analysis if the goal is to attract, or design for, a wider range of users.

A simple list of user characteristics often fails to influence design.
Disembodied user characteristics may result in an “elastic
user” whose characteristics shift as various features are developed.
Designing for an elastic user may create a product that fails to satisfy
any real user. Cooper [28] developed the concept of personas to
represent the user characteristics in a concrete and understandable
manner. A persona is a hypothetical person developed through
interviews and observations of real people. Personas are not real
people, but they represent key characteristics of the user population
in the design process. The description of the persona includes
not only physical characteristics and abilities, but also the persona’s
goals, work environment, typical activities, past experience,
and precisely what he or she wishes to accomplish. The persona
should be specific to the point of having a name.

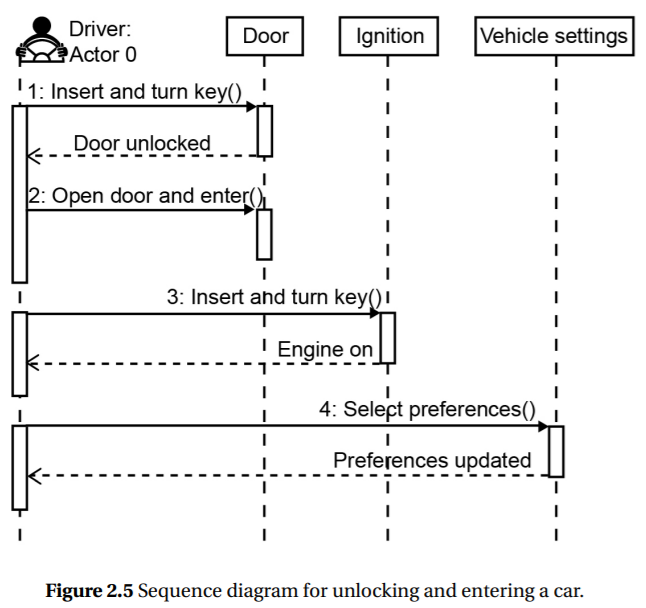
Sequence diagrams help define personae by identifying roles,
tasks, and communications. The task hierarchy specifies goals
and motivations. For most applications, three or four personae
can represent the characteristics of the user population. Separate
personae may be needed to describe people with other roles in
the system, such as maintenance personnel. The personae exist
to define the goals that the system must support and describe
the capabilities and limits of users in concrete terms. Personae
describe who the design is for and act as the voice of the user,
preventing the natural tendency of the design team to assume
users are like themselves.

Because personae define several “typical” users, this method
runs the risk of neglecting the extremes, such as the 5th and 95th
percentiles of a population. Techniques to systematically accommodate
these extremes are discussed in the context of fitting designs
to the physical dimensions of people in Chapter 12.


Design Exercise:
Stanford wallet project
This exercise provides a brief exposure
to design thinking. The goal is to
practice designing and recognizing a
user’s need and then translating that
need into a protype product that is
then evaluated.
This exercise is an abbreviated
version of the StanfordWallet
Project [45]. Depending on time,
each step can be completed in less
than five minutes.
Step 1 Everyone. Design/draw the
ideal wallet.
(Recognize that your perfect wallet is
not perfect for others.)
Step 2. Pair up in teams of two. Person
1 acts as the designer. Person 2
acts as the user.
Step 3. Show NOT tell. Designer asks
user about the ideal wallet. Some
questions to consider: What should
it look like? How should it feel? What
should it be able to hold? How do you
want to carry it? What functions do
you want?
Step 4. Switch roles. Person 1 is now
the user. Person 2 is now the designer.
Step 5. Continue Show NOT tell.
Repeat Step 3.
Step 6. Self reflection Designer explains
the users needs in one sentence:
“[user] needs a way to [user’s
needs] because... (or “but”... or “surprisingly”...)

Table 2.2 Stanford design exercise

Scenarios, user journeys, and use cases complement personas.
Personas are detailed descriptions of typical users and scenarios
are stories about these personas in a particular context. Scenarios,
also termed user journeys, describe situations and tasks relevant
to the use of the system or product being developed. Scenarios
are a first step in creating the sequence of screens in software development,
and they also define the tasks users might be asked to
complete in usability tests. In creating a scenario, tasks are examined,
and only those that directly serve users’ goals are retained.
Two types of scenarios are useful for focusing scenario specification
on the design. The first is daily use scenarios, which describe
the common sets of tasks that occur daily. In the car example, this
might be the sequence of activities associated with entering the car
when parked in the owners’ garage. The second is necessary use
scenarios, which describe infrequent but critical sets of tasks that must be performed. In the car example, thismight be the sequence
of activities associated with entering the car during a snowstorm.
Scenarios can be thought of as the script that the personae follow
in using the system[28].

Scenarios typically support conceptual design, where the general
activities of people are described independent of technology.
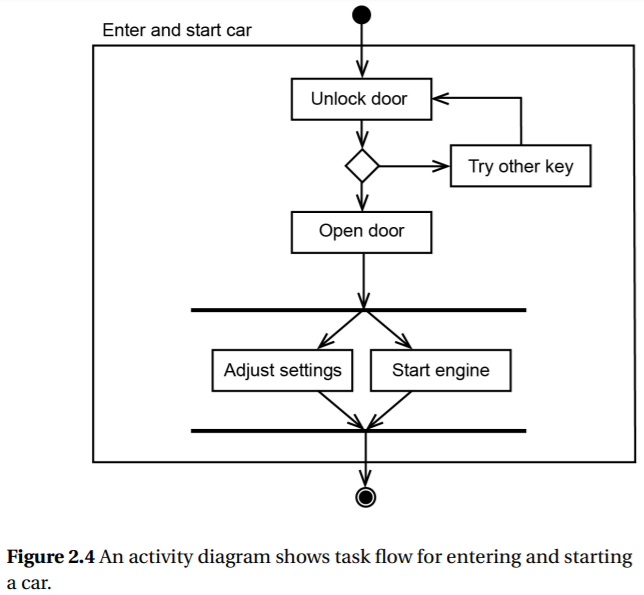
Use cases help move from conceptual design to prototypes. Use
cases are a user-centered description of what the technology is
meant to do. At the simplest level, a use case is a sequence of tasks
that produce ameaningful outcome, such as entering and starting
a car. These tasks can be described in a more formal way in a flow
diagram and implemented in a software or hardware prototype.

Observations organized in task hierarchies, flows, and sequences
help define personae and scenarios. Personae and scenarios, in
turn, help define new task hierarchies, flows and sequences that
the new design will make possible. As an example, a flow diagram
associated with the new system, such as a keyless entry system
for a car, would document the intended interactions between the
person and new system. Often it is possible to use scenarios, use
cases and personae to create prototypes. Personae and scenarios
also provide a starting point for more specific task analysis, such
as those that focus on the environment, workload, safety, and automation.
The type of analyses needed depends on the scope of
the design and the particulars of the system.

Environment and context analysis describes where the tasks,
scenarios, and personae live. For example, if ATMs are to be placed
indoors, environmental analysis would include a somewhat limited
set of factors, such as type of access (e.g., will the locations be
wheelchair accessible?), weather conditions (e.g., will it exist in a
lobby with outdoor temperatures?), and type of clothing people will
be wearing (e.g., will they be wearing gloves?), issues considered
in more detail in Chapter 14 where we discuss the physiology of
work. Beyond the physical environment, the culture and norms of
workplace should be considered as discussed in Chapter 18.

2.3.3 Step 3: Interpret Task Data

fizik100 fizik100 fizik100 · 1400/8/11 17:31 ·

Once task-related information has been collected, it must be organized,
summarized, and analyzed. At the simplest level, the task
analysis might be summarized as a list of challenges faced by people.
As an example, observing drivers trying to unlock their cars
during aWisconsin winter could show how fumbling for keys might
threaten drivers with frostbite. Sometimes these challenges can
inspire important innovations, but often a more detailed analysis
of tasks is needed to identify solutions and to avoid unintended
consequences. Some of the most common ways to organize task
data include:

1. Task hierarchy: Goal, task, subtask decomposition

2. Task flow: Control, decisions regarding the flow from one
task to another

3. Task sequence: Task duration and sequence, as well as communication
between system components

Task hierarchy data can be shown as an arrangement of tasks
where tasks are broken into more specific subtasks. Goals are at the
top of the hierarchy and the tasks at the bottom represent detailed
actions needed to accomplish those goals. The tasks higher in the
hierarchy are why the ones below are performed, and the tasks
lower in the hierarchy describe how the tasks above are achieved.
A task hierarchy makes it possible to organize a complex array of
many actions into a few general tasks, linking a detailed description
to a more general description.

Figure 2.3 shows a task hierarchy for unlocking a car prior to
driving. General tasks, such as “Car entry” are broken into more
specific tasks, such as “Unlock car” and “Open driver side door.”
These are further broken into very specific actions. For “Unlock car”
thismight include “Find key and key fob”, “Press Open on key fob,”
and so on. The level of task hierarchy should be aligned with the
purpose of the analysis and should avoid unnecessary detail. Figure
2.3 shows how the purpose of the analysis focuses attention on
describing unlocking the car and so the “Buckle seatbelt” activity
is not broken into subtasks.

A task hierarchy prompts innovation by identifying different
ways of achieving the same overall task with different subtasks. For
example, considering different ways you can perform“Car entry”
may lead to the use of a smart phone rather than keys. A task hierarchy
also makes it easy for the analyst to develop spreadsheets to
record information for each task or subtask. The spreadsheet contains
a row for each task, and columns for information describing
the tasks. This information might include task duration, conditions
thatmust be met to performthe tasks, why the task is difficult, common
errors, strategies, skills, or knowledge. One simple analysis
that might be part of a time-motion study is to use a spreadsheet
to calculate total task time and compare it with a new design with
different tasks

Figure 2.3 Task hierarchy for driving a car with a focus on unlocking the
door.

Task flow data from one task to another is captured by a flow
chart. Activity diagrams build on flow charts and also show tasks
that are performed concurrently (Figure 2.4). This diagramshows
the flow from one task to another and the decision points that
determine which task should follow. The flow from one task to
another can be sequential, shown as an arrow connecting tasks,
which are shown as rounded rectangles. The flow can also be
branched, where the decision to flow to one task or another is
indicated by a diamond. The flow can also be concurrent where
tasks can occur in parallel, which is indicated by a set of tasks
bounded on the top and bottom by horizontal bars.


Figure 2.4 An activity diagram shows task flow for entering and starting
a car.


Figure 2.4 shows an activity diagram for the entering and starting
the car. It begins with unlocking the door and finishes when
the settings are adjusted and the engine is started. The diamond
after the unlock door indicates that the door can be opened only
if the correct key is turned and loop from the diamond back to
unlock door indicates that keys are tried until the correct one is
inserted. After opening the door, the horizontal bar indicates that
the settings can be adjusted and the engine can be started in any
order.


Activity diagrams highlight decisions and the information required
to make them. Sometimes this information is trivial and
built into the interaction, such as the resistance experienced with
the wrong key is used to open a car door. In other situations, identifying
the cues that guide decisions can specify critical information
for an interface. Activity diagrams also indicate mandatory
ordering of tasks that need to be conveyed through the physical
configuration of the device, the interface, or through instructions.
In the case of a car, the physical configuration of the door and
key makes it impossible to start the engine before opening the
door. Positive locking of the door by a keyfob only outside the car
makes it impossible to lock ones keys in the car. Beyond inspecting
these diagrams, it is possible to “run” these diagrams as a computer
simulation and estimate the time it takes to performthese tasks.

Y Activity diagrams capture task
flow and information.
Sequence diagrams capture
task sequence and timing.

Task sequence data are shown in sequence diagrams that show
the order and duration tasks for each object and person in the
system. The activity of each person and object is represented as a
timeline that runs from the top of the diagram to the bottomand
rectangles on this timeline indicate when the person or object is
active in responding to other elements of the system. Horizontal
arrows indicate communication between people and objects. Solid
lines and arrows indicate synchronous messages, where a response
is required before other activities can proceed. Dashed lines with
open arrows indicate asynchronous messages, where activities can
proceed without a response. Responses are indicated by dashed
lines with open arrows at the of a rectangle.


Figure 2.5 Sequence diagram for unlocking and entering a car.


Figure 2.5 shows a sequence diagram for entering and turning
on a car. The left-most timeline begins with the driver inserting
a key into the door. The next timeline indicates the feedback provided
by the door that the door is unlocked. The driver then inserts
the key into the ignition and tries to start the car, which is indicated
by the engine being on. This figure shows a sequence diagram,
which focuses on one of many particular sequences of tasks. It
shows the sequence associated with inserting the correct key and
not what would have happened with the incorrect key or using
a key fob. Fault tree analysis (see Chapter 16 on system safety)
directly addresses how the probability of failure associated with
many tasks combine to influence safety. Sets of tasks with many
decision points are better represented by activity diagrams than by
sequence diagrams.

Sequence diagrams highlight communication, particularly the
responses that provide people with feedback regarding the success
or failure of their actions. Interaction design should ensure clear
and timely feedback. Diagrams that have manymessages that cross
several timelines indicate a need to reorganize and simplify the
communication so that each person or object communicates with
neighbors and that messages only occasionally cross timelines.
One way to avoid messages crossing multiple timelines is to ensure
that each object and person has a clear role that describes how it is
responds to messages. High activity for one person and low activity
for another might indicate workload that could be balanced by
adjusting the roles of each.

2.3.2 Step 2: Collect Task Data

fizik100 fizik100 fizik100 · 1400/8/11 17:17 ·

Task data are collected by observing and talking with multiple users.
The overall objective is to see the world through the eyes of the person
the system is being designed for, and to develop empathy for
the challenges, demands, and responsibilities they face. This empathy
helps focus attention to the details of the system that matter to
the user. These details might be very different than those that might
be noticed by the engineer implementing the design. The particular
way to understand users’ tasks depends on the information
required for the analysis. Ideally, human factors specialists observe
and question users as they performtasks in the place where they
typically perform those tasks. This is not always possible, and it
may bemore cost effective to collect some information with other
techniques, such as surveys or questionnaires. Task data collection
techniques include:

1. Observations and questions of people as they use an existing
system

2. Retrospective and prospective verbal protocol analysis

3. Unstructured and structured interviews including focus groups

4. Surveys and questionnaires

5. Automatic data recording

Observation involves watching users as they interact with existing
versions of the product or system. This is one of themost useful
data collection methods. If we were interested in car design, we
would find drivers who represent the different types of people the
car is to be designed for and then observe how they use their cars.
People are asked to performthe activities under a variety of typical
scenarios, and the analyst observes the work, asking questions as
needed. Observation should be performed in the environment that
the person normally accomplishes the task (See Table 2.1).

Source: Wikimedia Commons. 3
Probe questions for theMaster/Apprentice
observation approach:
Who and what is needed to perform
the task?
What happens before, what after?
What does the task change, how is
this detected?
What has to be remembered?
What is the consequence of failure to
complete the task?
When in the day, and when relative to
other events, is the task performed?
How do people communicate and
coordinate their activity?

Table 2.1 Observing people to guide
design.

The meaning behind users’ tasks is often revealed in their
thoughts, goals, and intentions, and so observations of physical
activity may not be sufficient to understand the tasks. This is particularly
true with primarily cognitive tasks that may generate little
observable activity. In such cases, it can be useful for people to
think out loud as they performvarious tasks. One approach is to
adopt a master-apprentice relationship, where the observer acts
as an apprentice trying to learn how the user performs tasks [39].
Adopting this relationship makes it easy for observers to ask questions that help users to describe their underlying goals, strategies,
decisions

Retrospective and prospective protocol analysis address important
limits of direct observations. Direct observations disrupt
ongoing activity or they can fail to capture rarely occurring situations.
For example, trying to understand how people deal with
being lost as they drive would be difficult to observe because talking
to the driver could be distracting and the analyst would have to
ride with the driver for many trips to observe the rare case that they
get lost. Talking about tasks is termed verbal protocol, and retrospective
verbal protocols require that people describe past events
and prospective verbal protocols require that people imagine how
they would act in future situations

Video recordings of users’ activity are an effective way to prompt
retrospective protocols. The human factors specialist and user can
watch the video together and the users can describe what they
were thinking as they performed the tasks. The human factors specialist
can pause the playback and ask probe questions. Because
users do not have to performthe task and talk about it at the same
time retrospective protocols can be easier on the user. Retrospective
protocols can even yield more information than concurrent
protocols.

Structured and unstructured interviews involve the human
factors specialist asking the user to describe their tasks. Structured
interviews use a standard set of questions that ensure the interview
captures specific information for all interviewees. Unstructured
interviews use questions that are adjusted during the interview
according to the situations. The analyst might ask about how the
users go about the activities and also about their preferences and
strategies. Analysts should also note points where users fail to
achieve their goals,make errors, show lack of understanding, and
seem frustrated or uncomfortable.

Unstructured interviews use probe questions similar to those
used for direct observation. These questions address when, how,
and why a particular task is performed, as well as the consequences
of not performing the task. Critical incident technique is a particularly
useful approach for understanding how people respond to
accident and near accident situations in high-risk systems. Because
accidents are rare, direct observation is not feasible. With
the critical incident technique, the analyst asks users to recall the
details of specific situations and relive the event. By reliving the
event with the user, the analyst can get insights similar to those
from direct observation [42].

Critical incident technique
makes it possible to “observe”
past events.

Focus groups are interviews with small groups of users, rather
than individuals [43, 44]. Focus groups typically consist of between
six and ten users led by a facilitator familiar with the task and
system. The facilitator should be neutral with respect to the outcome
of the discussion and not lead the discussion to a particular
outcome. One benefit of focus groups is that they cost less than individual interviews because they require less time for the analyst.
Also discussion among users often draws out more information
because the conversation reminds them of things they would not
otherwise remember.

Observations are typically more valuable than interviews or
focus groups because what people say does not alwaysmatch what
they do. In addition, peoplemay omit critical details of their work,
they may find it difficult to imagine new technology, and theymay
distort their description to avoid appearing incompetent. It is often
difficult for people to describe how they would perform a given
task without actually doing it—describe how you tie your shoes
without being able to touch and see your shoes.

Surveys and questionnaires are typically used after designers
have obtained preliminary descriptions of activities or basic tasks.
Questionnaires are often used to affirmthe accuracy of the information,
determine the frequency with which various groups of
users performthe tasks, and identify any user preferences or biases.
These data help designers prioritize different design functions or
features. See Chapter 3 for a more complete discussion of surveys
and their limits.

Automatic data recording uses smartphones and activity monitors
to record people’s activities unobtrusively. An example of such
a system is a data logging device that records the position of the
car, its speed, and any hard braking or steering events. Such a
device can show where drivers go, when they choose to travel, and
whether they travel safely. Such data has the benefit of providing a
detailed and objective record, but it lacks information regarding the
purpose behind the activity. This limitation might be avoided by
using automatically recorded data to prompt retrospective verbal
protocol.

Limitations of data collection techniques. All methods have
limits, but combinations of the methods can compensate. A more
general limit is that all of these methods document existing behavior.
Designing to support existing behavior means that new
controls, displays, or other performance aids might simply enable
people to do the same tasks better, butmight not produce dramatic
innovation. Innovation requires the analysis to focus on underlying
goals and needs, and identify different ways of accomplishing
these goals.

2.3 How to Perform a Task Analysis

fizik100 fizik100 fizik100 · 1400/8/11 16:58 ·

Most generally, task analysis is a way of systematically describing
human interaction with a system to understand how to match the
demands of the system to human capabilities. Task analysis is
a broad term that encompasses many other techniques such as
use cases, user stories, and user journeys. All of these techniques
focus on understanding the users’ goals and motivations, the tasks
and subtasks to achieve these goals, the ordering and timing of
these tasks, and the location and situation where tasks occur. Task
analysis consists of the following steps:

1. Define the purpose and identify the required data

2. Collect task data

3. Interpret task data

4. Innovate from task data

We describe this process as sequential, but in practice it is often
iterative. As an example a hierarchical task diagrammight be drawn
during an interview andmight be revised and adjusted as part of
the interview process. This diagram might be further refined based
on observations of work being performed. The observations and
analysis that make up a task analysis help focus on the activity
details that matter for the user. A deep, empathetic, and obsessive
understanding of these details is what makes designs succeed.


2.3.1 Step 1: Dene Purpose and Required Data

The first step of task analysis is to define the design considerations
that the task analysis will address. Because a task analysis can be
quite time consuming, it is critical to clearly define the purpose of
the analysis. Typical reasons for performing a task analysis include:

• Redesigning processes

• Identifying software and hardware design requirements

• Identifying content of the human-machine interface

• Defining procedures, manuals, and training

• Allocating functions across teammates and automation

• Estimating system reliability

• Evaluating staffing requirements and estimating workload

As an example, a task analysis for entering a car, adjusting settings,
and starting the engine could provide important information
to re-imagine the car key and create a new system for entering and
selecting vehicle settings. The task analysis could also be used to
define features of the interface to adjust settings, and could even
be used to define the content of the owner’s manual.

Both the purpose of the analysis and the type of task will influence
the information gathered. Tasks can be physical tasks, such as
opening the car door, or they can be cognitive tasks, such as selectingmusic
to listen to while driving after entering the car. Because
an increasing number of jobs have a large proportion of cognitive
tasks, the traditional task analysis is being increasingly augmented
to describe the cognitive processes, skills, strategies, and use of
information required for task performance. There are methods
specifically developed for cognitive task analysis [40, 41], but we
will treat these as extensions of standard task analyses, referring
to all as task analysis. However, designers should pay particular
attention to the cognitive components in conducting the analysis
if any of the following characteristics are present:

• Complex decision making, problem solving, diagnosis, or
reasoning

• Conceptual knowledge is needed to performtasks

• Large and complex rule structures that are highly dependent
on the situation

• Performance depends on memory of information that needs
to be retained for seconds or minutes

Whether the task analysis is focused on the physical or cognitive
aspects of the activity, four categories of information are typically
collected:

• Hierarchical relationships: What, why, and how tasks are
performed

• Information flow: Who performs the task, with what indications,
and with what feedback

• Sequence and timing: When, in what order, and how long it
takes to performtasks

• Location and environmental context: Where and under what
physical and social conditions tasks are performed

Hierarchical relationships

describe how subtasks combine
into tasks, and how tasks combine to achieve people’s goals. With
the car example, a goal is to keep the car secure, a task is to lock
the door, and subtasks include inserting the key, turning the key, or
press the lock icon on a keyfob. Moving up the hierarchy describes
why a task is performed—secure the car—and moving down the
hierarchy describes how a task is performed—turn the key/click
lock on keyfob. Describing the hierarchical relationships between
goals, tasks, and subtasks makes the reason for the many subtasks understandable. These hierarchical relationships help us focus
on the underlying goals of people and can prompt innovations by
identifying new and more efficient ways of achieving people’s goals,
such as securing the car using a keyfob rather than a key.


Y Hierarchical relationships
identify new ways of doing
things.


Information flow

specifies the communication between people
and the interactions between people and technology. This
information flow can also include stored information needed to
complete the task, such as knowledge and skills or information
on a display. With the car example, the flow of information might
include a signal to identify that the doors are unlocked. For some
systems, a complex network of people and automation must be
coordinated. In other systems, it may be only a single person and
the technology. However,most systems involve coordination with
multiple people. Defining their roles and their information needs
often identifies important design considerations that might otherwise
go unnoticed, such as how to get passenger preferred music
into the car.


Y Information flow helps specify
interface content.


Sequence and timing

describe the order and duration of tasks.
In the car example, the driver must first turn the key, then lift the
door handle, and finally pull the door open. Performed in a different
order, these tasks would not achieve the goal of opening the
door. In other situations, tasks could be performed in parallel. Task
sequence often determines howmuch time a set of tasks will take
to complete. Specific task sequence information includes the goal
or intent of task, sequential relationship (what tasks must precede
or follow), trigger or event that starts a task sequence, results or
outcome of performing the tasks, duration of task, number and
type of people required, and the tasks that will be performed concurrently.
Eliminating tasks, reducing their duration, or assigning
them to different people can make systems easier to use and more
efficient.


Sequence and timing specifies
efficient interactions.


Location and environmental context

describe the physical
and social world in which tasks occur. In the car example, important
location information might be the physical layout of the
vehicle interior that can make it difficult to insert the key to start
the car. Specific location information might include places people
work and the paths people take from one place to another, as
well as the location of equipment and the physical barriers such as
walls and desks. Location of equipment can greatly influence the
effectiveness of people in production-line settings. The physical
space can also have a surprisingly large effect on computer-based
work, as anyone who has had to walk down the hall to a printer
knows.


Physical layout can strongly
affect task difficulty.


The purpose of front-end analysis is to understand the users, their
needs, and the demands of the work situation. There are many
front-end analyses and they differ substantially in the time they
require. Hence, the analysis method needs to be matched to the
development timelines and priorities of a project. Not all activities
are carried out in detail for every project, but in general, the
designer will need to answer the following questions before design
solutions are created:

1. Who are the users? This includes not only users in the traditional
sense, but also the people who will install, maintain,
monitor, repair, and dispose of the system.

2. Why do users need the product and what are their preferences?

3. What are the environmental conditions under which the
system or product will be used?

4. What is the physical and organizational context of the users’
activity?

5. What major functionsmust be fulfilled by a person, team, or
machine?

6. Whenmust tasks occur, in what order, and how long do they
take?


Y “If you want to improve a
piece of software all you have
to do is watch people using it
and see when they grimace,
and then you can fix that.”
D. Kelley [38]


These questions are answered with various analyses that begin
by collecting data, often by observing and talking with people.
These data are then analyzed to support design decisions. We use
the term task analysis to describe this process, which can vary
substantially in its level of detail. In general, the more complex and
critical the system, such as air traffic control, the more detailed the
task analysis. It is not unusual to spend several months performing
this analysis for a complex product or system.

Although direct observation is the primary technique for collecting
information about tasks and activities, it is not always the
most effective. Accident prevention is a major goal of the human
factors profession, especially as humans are increasingly called
upon to operate large and complex systems. Although human
factors experts rarely observe accidents directly these critical incidents
can be analyzed to determine the underlying causes. In
Chapter 1 we discussed how Fitts and Jones interviewed pilots after
crashes and near crashes to identify opportunities to improve aircraft
design. Accident analysis has pointed to several cases where
poor system design has resulted in human error. As an example, in
1987 Air Florida Flight 90 crashed into the 14th Street Bridge on the
Potomac River shortly after taking off fromWashington National
Airport, killing 74 of the 79 passengers and crew. Careful analysis of
the events leading up to the crash identified training and decision
errors that led the pilots to take off even though snow and ice had accumulated on the wings. Accidents usually result from several
coinciding breakdowns, and so identifying human error is the first
and not the last step in understanding accidents.


The “Five Whys” help identify
the multiple causes of
accidents.


Practicing the “Five Whys” by tracing back the causes of an
event by asking “why” at least five times can be useful in going beyond
human error as the cause of an accident. For the Air Florida
Flight 90, this might mean asking why the aircraft had inadequate
lift? (ice accumulated on the wings). This leads to the question:
why did the aircraft take off with ice on its wings? (aircraft accumulated
ice as it waited in taxi line for 49 minutes before takeoff),
which then leads to the questions: why did the pilots decided not to
return for de-icing? (production pressure and lack of experience),
why did the pilots did not notice the severity of the icing problem as
they began taxied for takeoff? (captain failed to address concerns
of first officer). These series of questions typically show multiple
unsafe elements associated with training, procedures, controls and
displays, that should be considered before rather than after an accident.
This requires a proactive approach to system safety analysis
rather than a reactive one such as accident analysis or accident
reconstruction. This safety analysis is one particular example of
understanding users, their operating environment, and the tasks
they must performand is addressed in greater detail in Chapter 16,
where we discuss system safety.

In contrast to accident analysis, which typically focuses on systemsafety,
time-motion studies developed by Taylor (Chapter 1), focuses
on improving performance of manual work. Taylor’s detailed
observations dramatically improved steelworker productivity by
precisely recording the movements and timing of actions of workers
on assembly lines. These time-motion studies continue to be an
important technique to improve efficiency and avoid injury associated
with manualmaterials handling, which we discuss in more
detail in Chapter 13 (biomechanics). Human factors engineers can
incorporate knowledge gained in time-motion studies to understand
user needs, the context that the work is to be conducted, and
the sequences of tasks.


Time-motion studies identify
ways to improve worker
efficiency


Understanding users’ needs for computer systems and consumer
products often benefits from an approach termed contextual
inquiry [39]. Contextual inquiry provides an understanding
of users’ needs by going to users’ workplace or wherever the systemwould
be used, and adoptingmaster-apprentice relationship.
The interviewer acts as an apprentice learning from the master
regarding how to perform a particular activity. As an apprentice,
the interviewer asks the master to verify his or her understanding
by commenting on task descriptions and prototypes, as simple as
a series of sketches to show screens of a potential application.


Y Contextual inquiry reveals
user needs through careful
observation.


Understanding tasks is essential, whether the goal is to prevent
accidents, make assembly lines more efficient, or create delightful
products. This understanding goes beyond simply documenting
activity, but involves establishing a deep empathy for the user.
Without some formof front-end analysis, designers and engineers often find it hard to create systems that serve peoples’ needs effectively.
Depending on how the data are collected and analyzed,
the methods take on many names, but they all aimto understand
users, their environment, and the tasks they must perform. Here
we describe them under the general termof task analysis.